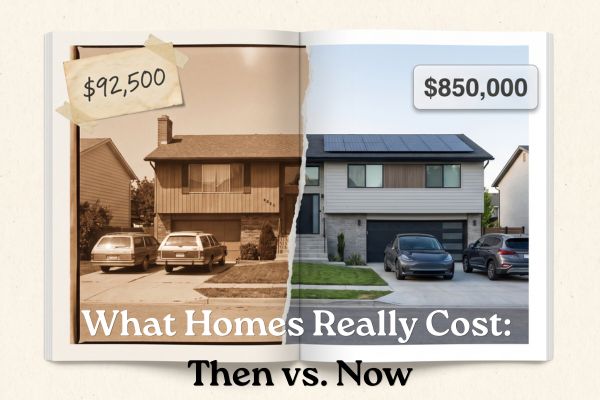
What Homes Really Cost: Then vs. Now
In 1970, the median U.S. home was valued at $17,000. By 1990, that number had climbed to $79,100 — without adjusting for inflation at all (U.S. Census Bureau). Numbers like that are easy to skim past. They're much harder to actually feel until you line them up next to what the same categories cost today. This is a running breakdown of exactly that — not just what a house cost, but what it cost to renovate one, furnish one, and keep one insured, then versus now.

What this guide is
Unlike the Decades guide, this page isn't organized by era — it's organized by category, because the channel's cost comparisons jump between very different kinds of spending: buying, renovating, furnishing, and owning.
Each section below covers one category, links to its companion video once published, and pulls in outside data to double-check the numbers rather than just repeating them. This page updates every time a new Then vs Now episode goes live.
Buying a Home
The headline number, and the one most people already have a rough sense of: median home values have risen in every decade since the Census started tracking them in 1940, climbing fastest in the 1970s (43%) and slowest in the 1980s (8.2%) even after adjusting for inflation (U.S. Census Bureau).

The Federal Reserve's long-running data series tracks this even further, showing the median sales price of U.S. homes stretching back to 1963 (FRED) — useful if you want to see exactly how steep the climb has been in any given stretch.
Renovating
Today, the national average kitchen remodel runs about $27,000, according to industry cost-tracking data — with a full custom overhaul easily running past $100,000 depending on scope (U.S. News). Bathrooms are a smaller project but not a small expense: the current national average sits around $12,000–$16,500 depending on the source and scope (Angi).
A precise, apples-to-apples 1985 figure is harder to pin down than the housing data above — renovation cost tracking wasn't standardized the way home sales were — which is exactly the kind of gap the companion video digs into directly.

Furnishing
Furnishing an entire home from scratch today runs, on average, around $16,000 nationally — with a realistic range anywhere from $3,500 for a minimal, budget-conscious setup to $100,000+ for a fully custom, high-end home (HomeAdvisor).
That wide range is itself a useful data point: it means "furnishing cost" isn't really one number then or now, it's a spectrum shaped by choices that haven't changed much in principle since the 1990s, even as the dollar figures have.

Owning
This is where the cost story gets less predictable, because owning a home isn't one flat expense — it's mortgage financing, insurance, and the size of the thing you're paying to maintain, and all three have moved differently over time.
Mortgage rates are the clearest reversal of "things were worse back then": the average 30-year fixed rate peaked at 16.63% in 1981, and briefly touched 18.63% that October — meaning a $100,000 loan cost roughly $1,393 a month in principal and interest alone, versus around $646 at a more typical recent rate on the same balance (Housing Almanac). Today's rates, hovering in the 6% range, sound high only by the standard of the unusually cheap 2010s — not by the standard of the 1980s.
Square footage tells a more complicated story than "homes keep getting bigger." The median new home has grown substantially since the early 1980s — from around 1,700 square feet in 1981 to over 2,100 square feet in recent Census data — but new-home size has actually been shrinking since a 2015 peak, as builders trade space for a price buyers can still finance (Homesnacks).
Insurance is the newest and steepest curve of the three: nationally, average homeowners insurance premiums rose about 24% between 2021 and 2024 alone, more than twice the rate of inflation over the same period (Consumer Federation of America).

Why the Comparison Isn't Apples-to-Apples
A raw dollar figure from 1985 next to a dollar figure from today will always look dramatic — and it's also, on its own, a little misleading. A dollar in 1985 simply bought more than a dollar does now, homes today are often larger and more heavily equipped than their 1980s counterparts, and wages haven't climbed at the same pace as home prices in every decade.
Every episode in this pillar tries to note when a figure is adjusted for inflation and when it isn't, because the honest version of "what did this cost then" is usually more interesting than the shock-value version — and it holds up better under a second look.
The Real Takeaway
Every number in this guide will be out of date within a few years — that's the nature of cost data. What doesn't go out of date is the pattern underneath it: homes get bigger, then smaller again; rates spike, then settle; a dollar stretches further in memory than it did in reality. That pattern is the actual subject of this pillar, and it's why this page will keep getting revisited long after any individual figure above has been overtaken by a new one.
